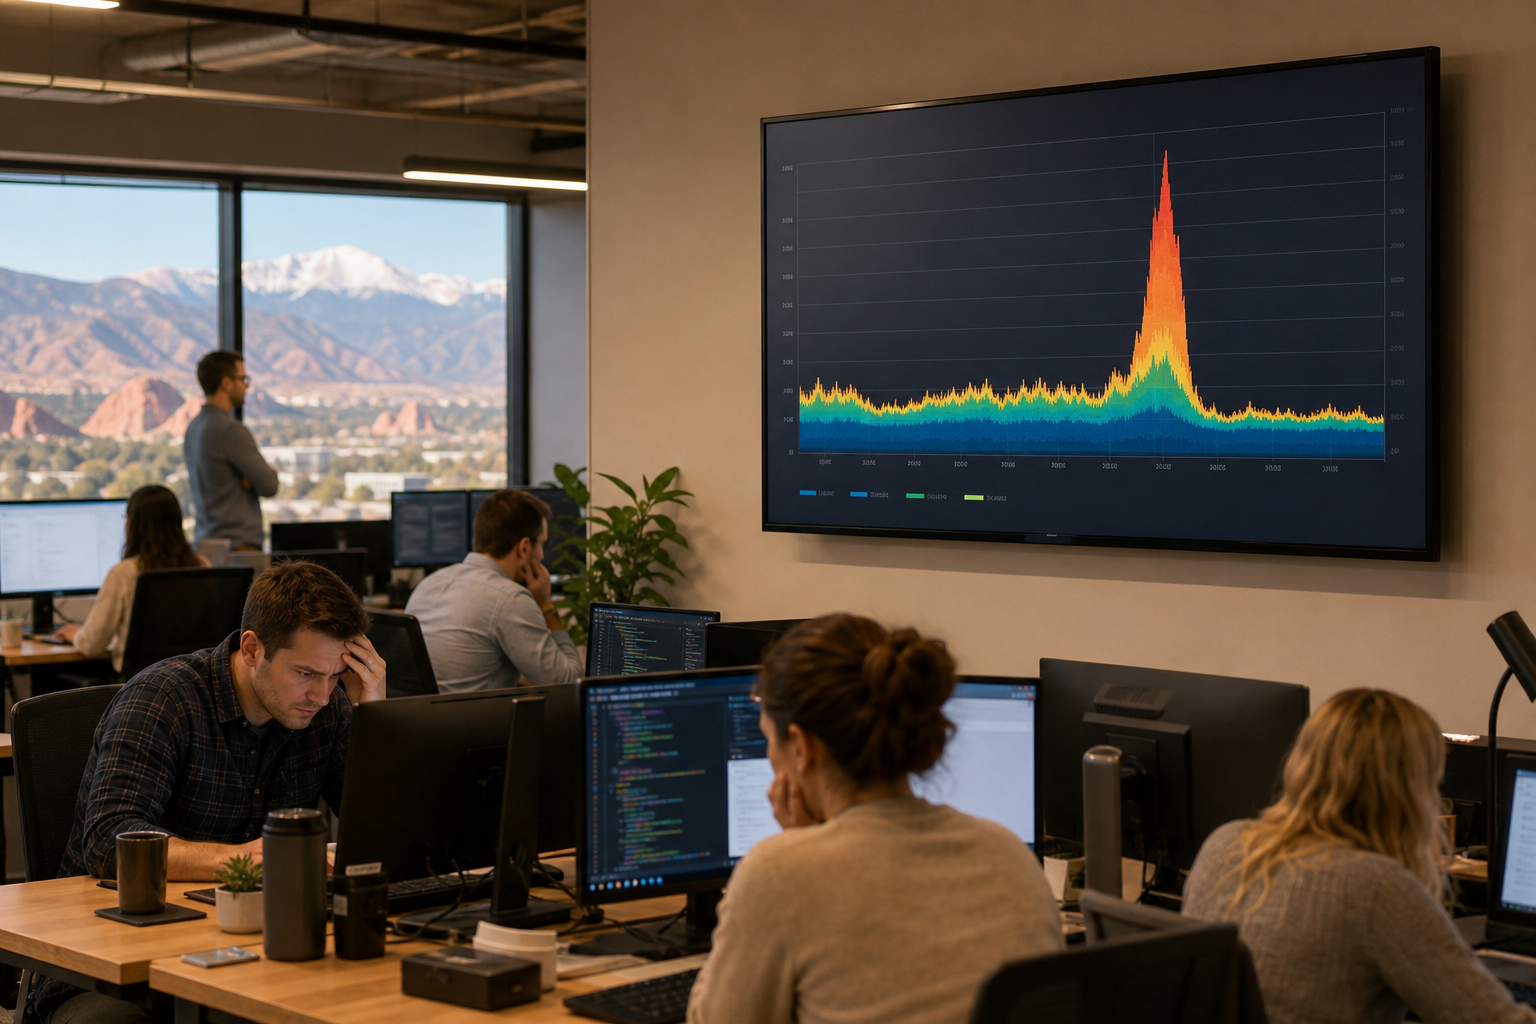
At 2:15 every afternoon, the phones still work, Microsoft 365 still signs in, and the internet speed test may even look decent. But the office feels stuck. Files crawl. Cloud apps lag. Calls get choppy. Then by 3:30 or 4:00, everything clears up without anyone touching a thing. If your network slows down same time every day, that timing is not a coincidence. It is evidence.
A business network usually gets slow at the same time every day because a repeatable traffic event is competing with normal work. Common causes include scheduled cloud backups, sync jobs, software updates, camera uploads, large file transfers, or guest and voice traffic colliding during a known business window. The right first step is to review utilization history and traffic categories before assuming you need more internet speed.
I see this in Colorado Springs offices more often than people expect. Mid-year operating reviews are a good time to go back through recurring complaints and ask a simple question: is the problem random, or does it happen on a schedule?
Why does a business network get slow at the same time every day?
It usually happens because the network is not slow all day. It is congested during one predictable period when multiple traffic classes or scheduled data activity overlap. That points to contention, not necessarily a bad circuit.
Here is a straightforward example. Picture a 45-person professional services office in Colorado Springs. From 8:00 a.m. to about 1:30 p.m., business applications run normally. Staff use Microsoft 365, a line-of-business cloud platform, VoIP phones, and shared file access without complaints. Around 2:00 p.m. every day, the whole office starts reporting delays. The CRM stalls. PDF uploads take far longer than usual. Calls sound clipped. By 3:45 p.m., performance returns to normal without rebooting anything.
That is the pattern you pay attention to. If the network slows down same time every day, I do not start by saying, “buy a bigger connection.” I start by asking what else begins around 2:00 p.m.
- Does a server or NAS start syncing to the cloud?
- Do workstations begin pushing backups?
- Are security cameras uploading retained footage offsite?
- Does a document management system replicate data on a schedule?
- Are software patches or large package downloads kicking off after lunch?
- Does a guest network fill up when customers or visitors return to the building?
According to Cisco, application visibility and control matters because different traffic types place very different demands on the network. Real time traffic like voice reacts poorly to delay and jitter, while backups and sync traffic can consume large chunks of bandwidth without anyone noticing until other applications suffer.
What should a Colorado Springs office check first when the network slows down same time every day?
Start with utilization history over time, not a live guess. You want to know what the connection looked like before, during, and after the slowdown window, and which traffic categories were active.
In the Colorado Springs example above, a week of firewall history might show this:
| Time | Observed behavior | Likely clue |
|---|---|---|
| 8:00 a.m. to 1:30 p.m. | Normal application performance, low call issues | Baseline capacity appears adequate |
| 1:45 p.m. to 2:00 p.m. | Outbound traffic rises sharply | Scheduled upload or sync begins |
| 2:00 p.m. to 3:30 p.m. | Cloud apps lag, voice quality drops, file transfers slow | Competing traffic classes cause congestion |
| 3:30 p.m. to 4:00 p.m. | Usage falls, apps recover without intervention | Scheduled job ends on its own |
A weak diagnosis sounds like this: “The internet is bad in the afternoon.” A stronger diagnosis sounds like this: “Outbound utilization jumps from 22 percent to 91 percent between 1:52 p.m. and 3:34 p.m. on 9 of the last 10 business days, and the increase is mostly backup, sync, and large HTTPS transfer traffic.” Those are two very different conversations.
I like numbers because they keep everybody honest. If the complaint window is 90 minutes, I want to see 90 minutes of data. If the problem shows up 5 days a week, I want at least 2 to 4 weeks of history, not one screenshot.
For many small and mid-sized businesses, this is where proactive support makes a difference. A provider that is already tracking trends can spot recurring congestion before it turns into a vague office complaint. We break that down in what proactive remote IT support actually looks like day to day.
Colorado Springs offices often notice these patterns more during summer and early fall, when tourism, events, or seasonal staffing shifts can change afternoon traffic inside the building. In mixed-use areas and busy corridors, guest traffic and cloud app usage patterns can become more obvious during the same part of the day, even when the internet circuit itself has not changed.
Which traffic sources are most likely to cause a repeatable afternoon slowdown?
The usual suspects are scheduled uploads, sync activity, backups, update windows, and traffic classes that are allowed to compete equally with real business applications. The key is repeatability.
Here are the sources I check first in a 10 to 150 user office:
- Cloud backup jobs. Servers, file shares, and endpoint backup agents often start after lunch or mid-afternoon. If several systems begin uploading at once, outbound traffic gets crowded fast.
- Microsoft 365 or SharePoint sync activity. Large Teams recordings, OneDrive changes, and department-wide file updates can create a daily burst.
- Line-of-business application replication. Healthcare, construction, hospitality, and professional services platforms sometimes move data on a timer.
- Security camera or retained media uploads. Not every camera system does this, but when it does, it can be substantial.
- Patch distribution or software package downloads. A scheduled deployment at 2:00 p.m. will not look like bad internet. It will look like a self-inflicted rush hour.
- Voice, guest, and business app traffic sharing the same lane. This is where quality-of-service observations matter. Not every environment has a full QoS strategy in place, and not every firewall is classifying traffic correctly.
The FCC has long noted that network performance is more than raw throughput. Latency, jitter, and packet loss affect real-time services like voice and video even when available bandwidth looks acceptable on paper.
"If everything breaks at the same time every day and fixes itself at the same time every day, I assume the network is telling us a story. We just need the logs and traffic history to read it." , Jeff
One caution here. Traffic prioritization can help in the right situation, but it is not magic. If a backup job is saturating the uplink and the circuit is undersized for the business, prioritization may reduce the pain for voice while cloud file work still drags. You still need to match the fix to the cause.
How do utilization history, application categories, and QoS observations isolate the cause?
They turn a vague complaint into a testable sequence. Utilization history shows when the problem happens. Application categories show what type of traffic is active. QoS observations show whether important traffic is being protected or forced to compete.
A practical diagnostic sequence looks like this:
- Mark the complaint window. Example: 2:00 p.m. to 3:30 p.m., Monday through Friday.
- Compare inbound and outbound utilization. If outbound spikes from 18 percent to 88 percent every afternoon, uploads are a likely factor.
- Review application categories. Look for backup, file sync, software updates, video, voice, remote access, and guest traffic.
- Match timestamps to scheduled tasks. Backup software, NAS replication, Microsoft 365 sync behavior, patching tools, and camera systems all have logs.
- Check QoS behavior. Are voice and business-critical apps classified correctly? Are they seeing drops, delay, or queue contention?
- Confirm recovery behavior. If performance returns the moment a scheduled process stops, that is a strong clue.
The National Institute of Standards and Technology, through NIST, consistently emphasizes logging, monitoring, and baseline behavior as part of sound operational and security practice. That same discipline helps with performance. You cannot fix patterns you do not measure.
Here is what that might reveal in our hypothetical Colorado Springs office:
- A backup appliance begins offsite replication at 1:50 p.m.
- At 2:05 p.m., 32 endpoints also start cloud sync after lunch-hour file changes.
- Voice traffic is marked, but not consistently prioritized through the firewall queues.
- Outbound usage stays above 85 percent for 96 minutes on most weekdays.
- At 3:32 p.m., the replication job ends and voice quality complaints stop within minutes.
That is not random slowness. That is a repeatable congestion event.
What to ask your IT provider before anyone recommends a new circuit
- Can you show me 30 to 60 days of utilization history, not just a speed test?
- Which application categories were active during the slowdown window?
- What scheduled jobs run during that time, and on how many devices?
- Did you check inbound and outbound traffic separately?
- What do the voice or QoS queues show during the problem period?
- Can you tell me what we do not need to buy yet?
What fixes make sense once the cause is confirmed?
The right fix depends on which traffic source is causing the recurring congestion. Sometimes the answer is rescheduling a job. Sometimes it is cleaning up sync behavior. Sometimes it is a policy change. Sometimes capacity really does need to change, but only after the evidence says so.
Examples matched to cause:
- Backup or replication job at the wrong time. Move it outside the active work window, stagger endpoints, or rate-limit the transfer.
- Too many devices syncing together. Adjust sync scope, schedule, or departmental workflows that trigger bulk afternoon uploads.
- Voice and critical apps competing with bulk traffic. Correct traffic classification and queue behavior, then verify results with post-change measurements.
- Guest traffic interfering with office operations. Separate policies and limits may be enough.
- True sustained capacity constraint. If business-critical usage is regularly near saturation even after cleanup, then a circuit review is reasonable.
I am careful here because businesses get sold hardware and bandwidth upgrades for problems that are really scheduling problems. On the other hand, I am not going to pretend every network issue can be fixed with traffic rules. If the numbers say you have grown beyond current capacity, we say that plainly.
If your review also turns up backup concerns while you are tracing network load, it is worth looking at backup and recovery costs, what to expect, and how to choose in Colorado Springs. Backup performance and backup design are related, but they are not the same decision.
Frequently Asked Questions
Can this kind of slowdown be fixed quickly?
Sometimes, yes. If the cause is a scheduled job running at the wrong time, the same-day fix may be as simple as rescheduling, staggering devices, or applying a sensible bandwidth cap. If the pattern involves several systems or a poorly understood application mix, it can take a few days of logs and testing to confirm the safest change.
Does a recurring afternoon slowdown always mean we need more internet bandwidth?
No. If the network slows down same time every day, the pattern often points to avoidable contention before it points to raw capacity. More bandwidth may be the right answer after cleanup and measurement, but it should not be the default answer. Otherwise, you can spend more and still keep the same badly timed traffic behavior.
For Colorado Springs offices, the practical takeaway is simple. If cloud applications behave normally most of the day, then slow down in a repeatable afternoon window and recover on their own, start with traffic patterns first. Review utilization history. Break out application categories. Compare those times to sync jobs, backups, updates, and voice behavior. If your network slows down same time every day, the clock itself is one of your best clues.
That is also the kind of issue we like to show our work on. Before anybody talks about replacing gear or buying a bigger pipe, I would rather put the history on the screen and prove what is happening.
See the traffic pattern before you buy anything
If your Colorado Springs office sees cloud apps or phones bog down during the same daily window, we can review how that congestion is measured, what logs matter, and whether the cause is scheduled activity, competing traffic classes, or a real capacity limit. Book a discovery call with QuByte Systems to review the current stack, identify gaps, and see the evidence behind the recommendation. Beyond IT support. Engineering what comes next.
Book a discovery call